Balance Catamarans, TOF Expansion Report, August 2026
Supporting ReportAugust 2026
Top-of-Funnel Expansion: Where the Conversion Really Happens
A closer look at our two entry points, the Comparison Chart and the Pricing Guide Video: how their landing pages and lead forms are converting, and what the new high-intent tests are showing so far.
BC
Balance Catamarans
The picture, at a glance
Both entry points bring people in and both landing pages convert at roughly the same rate. The difference between them, and the drop we see on the new tests, is happening at the form step, not the page. That is the lever worth pulling.
Snapshot as of August 7, 2026. Subscriber totals from the campaign tracker; conversion figures from the A/B tests below (Thrive). "CC" = Comparison Chart, "PV" = Pricing Guide Video.
New Subscribers
376
280 from the Comparison Chart, 96 from the Pricing Guide Video. 17 people signed up for both.
Landing Page Conversion
~9–11%
The two pages convert almost identically (CC 10.08%, PV 10.91% on the control), so the page is not the gap.
Best Form Conversion
47% / 41%
The short "name + email" forms. CC 47.28%, PV 40.94%. This is where CC pulls ahead of PV.
Calls Booked
0
Same gap flagged in the July report: the engine fills, but nothing yet carries a lead to a booked call.
1. Comparison Chart vs Pricing Guide Video
Side by side, the Comparison Chart is the stronger entry point across the board. But the reason is specific, and it is worth being precise about, because it tells us where to spend our effort.
Metric
Comparison Chart
Pricing Guide Video
Subscribers
280
96
Lead form conversion
47.28%
short "name + email" form
40.94%
short "name + email" form
Landing page conversion
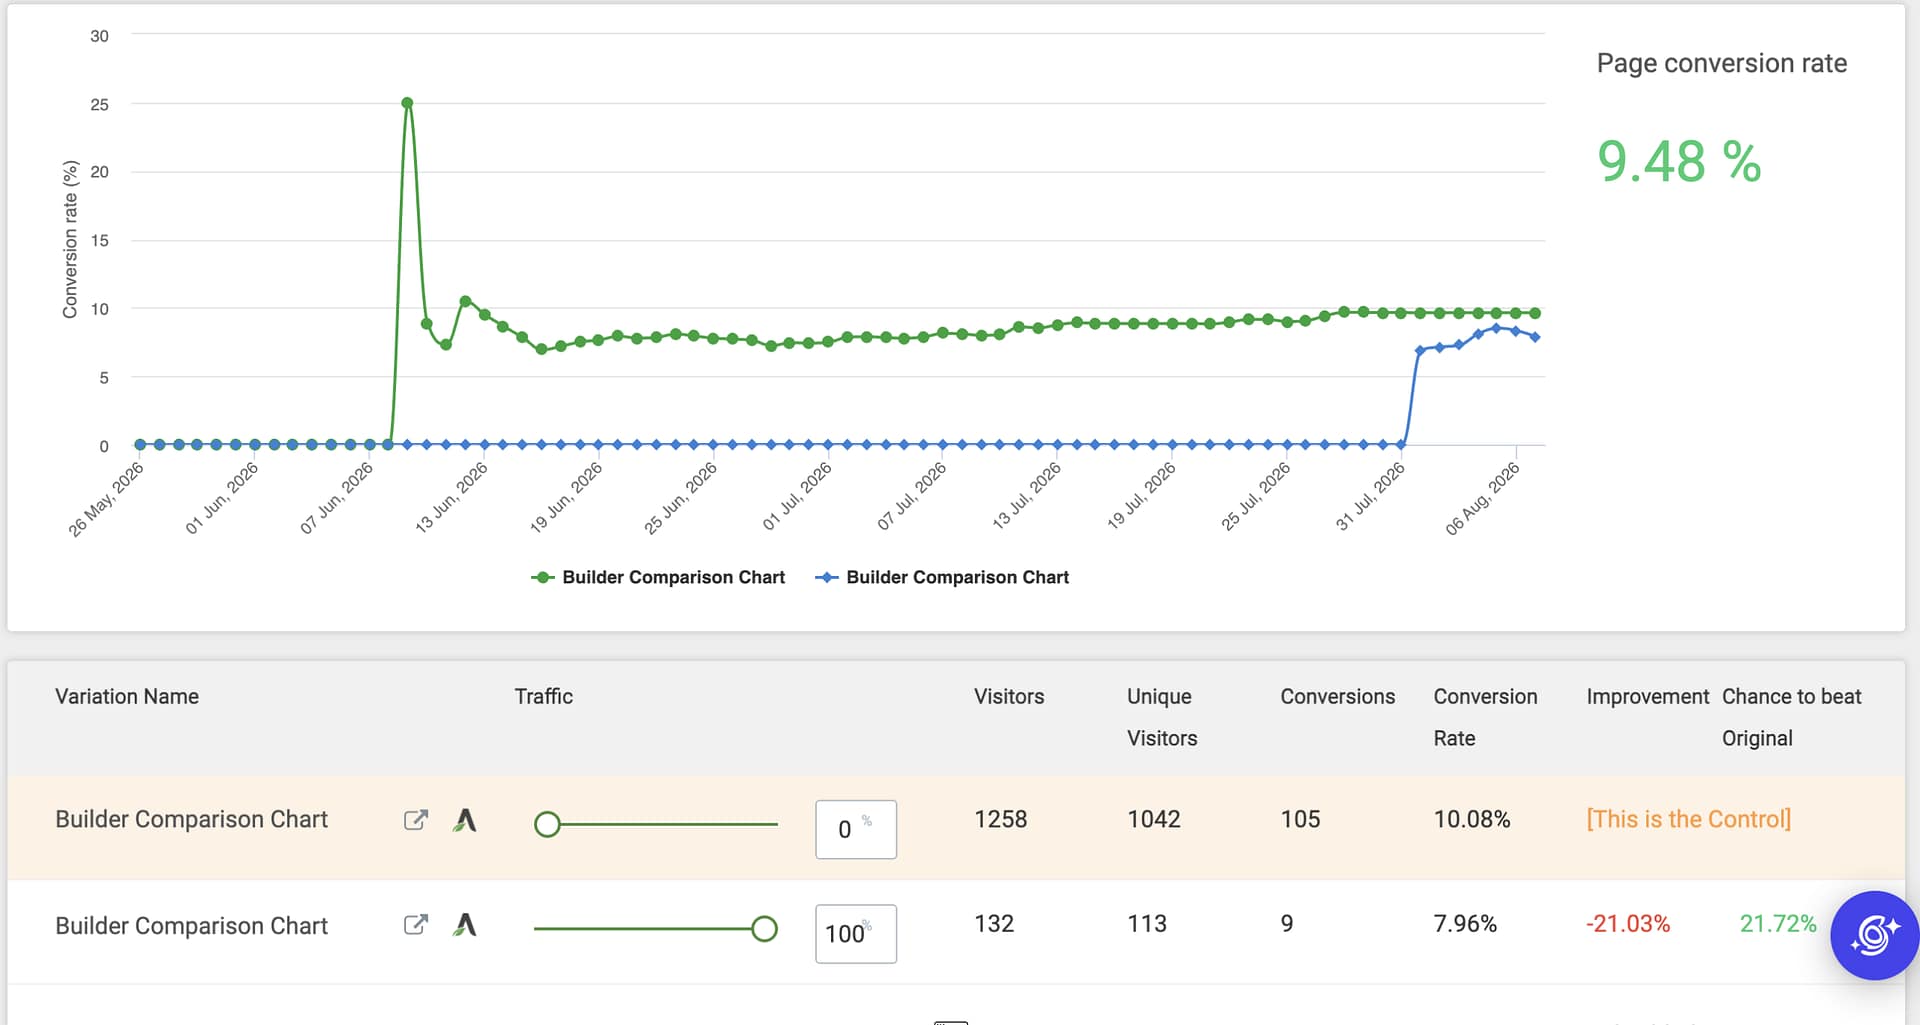
10.08%
control variant
10.91%
control variant
Notice the landing pages are basically tied (10.08% vs 10.91%), so the volume gap is not coming from a better-converting page. It is coming from the form: 47.28% vs 40.94%. The form is the real lever.
2. The landing pages: control vs high-intent
On both pages we are testing a "high-intent" variant against the original. The high-intent version asks visitors for more before they get the download, so we expect fewer people to convert, in exchange for a much better read on who they are. Early on, that is exactly what we see, and both tests are still small.
Comparison Chart page
Variant
Visitors
Conversions
Conv. rate
vs Control
A · Control
1,042
105
10.08%
baseline
B · High-intent
113
9
7.96%
-21.0%
21.7% chance to beat
Comparison Chart landing page, A/B test (Thrive). Variant A is the control; Variant B is the high-intent version. Source screenshot.
Pricing Guide Video page
Variant
Visitors
Conversions
Conv. rate
vs Control
A · Control
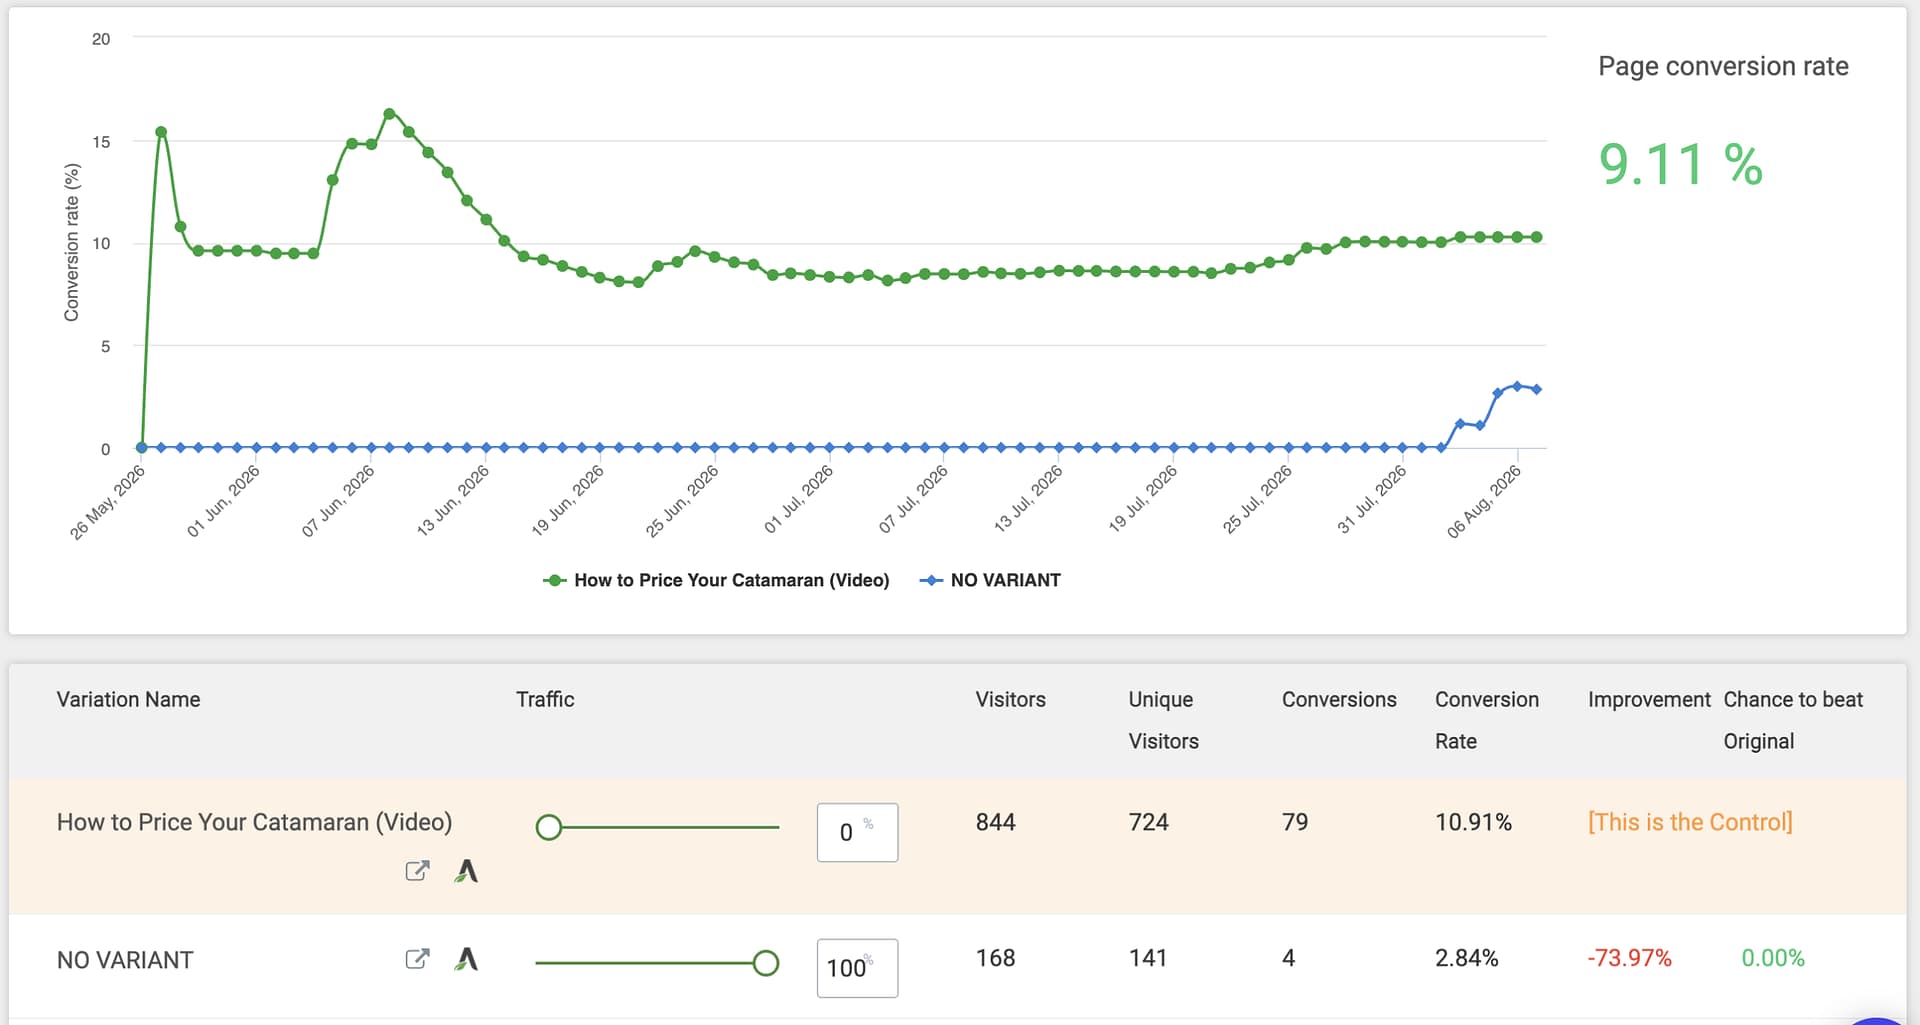
724
79
10.91%
baseline
B · High-intent
141
4
2.84%
-74.0%
0% chance to beat
Pricing Guide Video landing page, A/B test (Thrive). Variant A is the control; Variant B is the high-intent version. Source screenshot.
How to read these tests
Control (Variant A) is the original page, kept running as the benchmark. Variant B is the new high-intent version we are trialling against it.
"Chance to beat" is the tool's confidence that Variant B will end up better than the control. Higher is better; 21.7% and 0% both mean the high-intent version is currently behind, not ahead.
Sample size matters. Variant B has only seen 113 and 141 visitors (9 and 4 conversions). That is far too little to call a winner, so read these as an early direction, not a verdict. On purpose, we accept a lower conversion rate here in exchange for higher-quality, better-qualified leads.
3. The forms: short vs long
Because the form is the real lever, this is where the trade-off is clearest. The short "name + email" forms convert far better. The new long forms convert less, but every long-form lead hands us their boat of interest, budget, and timeline. Cheaper signups, or richer signups: the numbers put a price on that choice.
Comparison Chart form
Form
Impressions
Conversions
Conv. rate
Short · name + email (control)
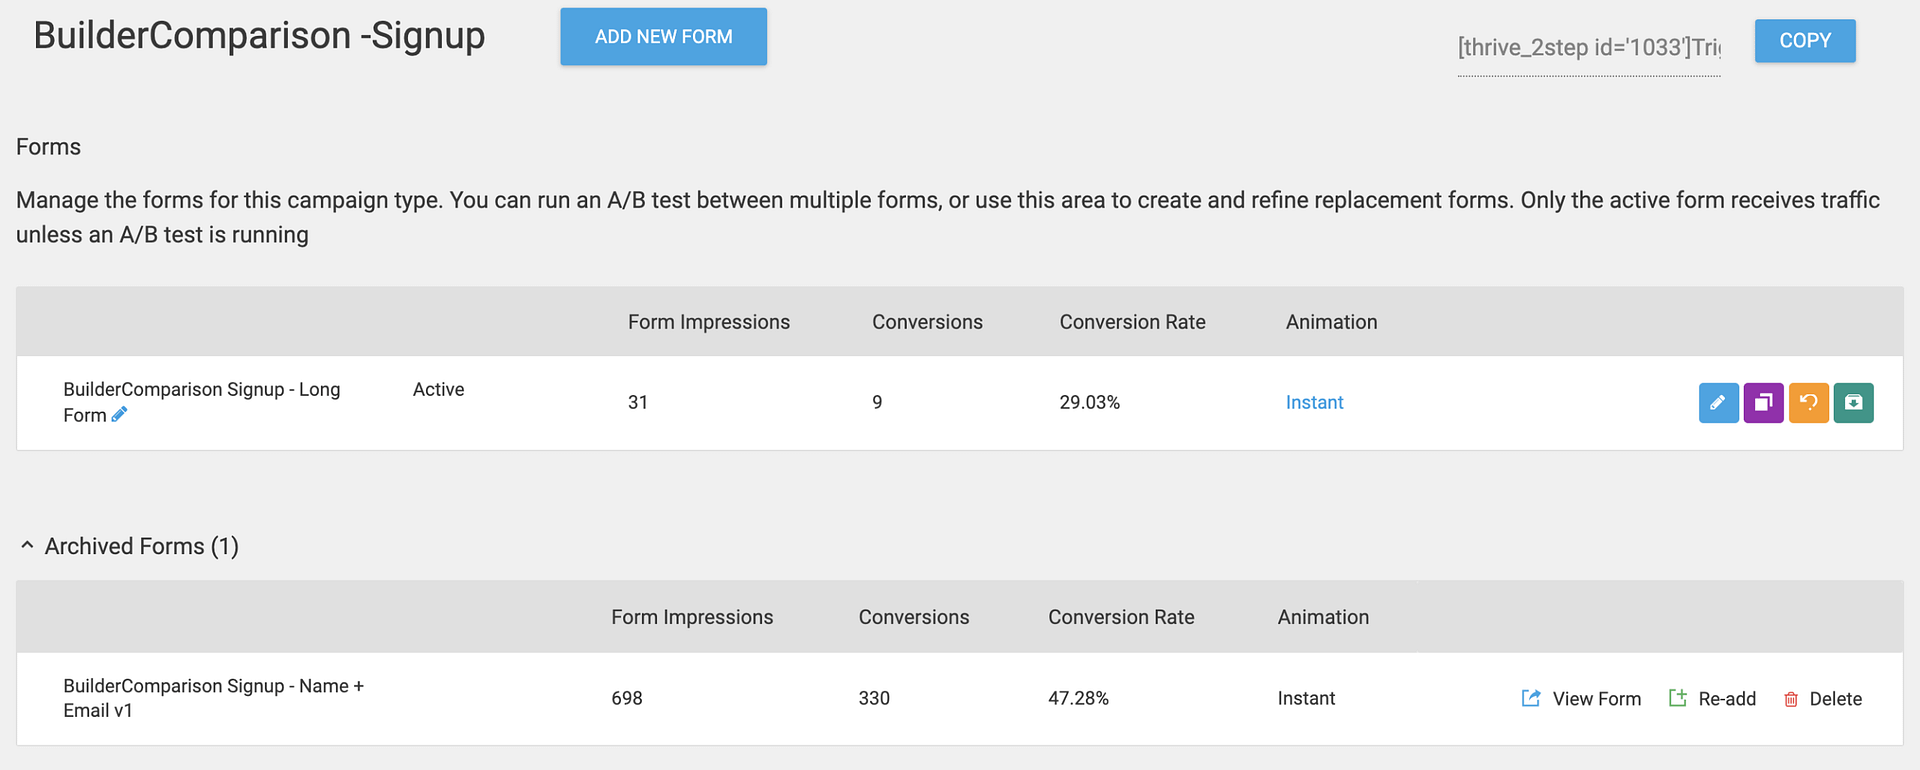
698
330
47.28%
Long · high-intent (active)
31
9
29.03%
Comparison Chart lead form (Thrive). The archived "name + email v1" is the short control; the active "Long Form" is the high-intent version. Source screenshot.
Pricing Guide Video form
Form
Impressions
Conversions
Conv. rate
Short · name + email (control)
320
131
40.94%
Long · high-intent (active)
63
6
9.52%
Pricing Guide Video lead form (Thrive). The archived "name + email v1" is the short control; the active "Long Form" is the high-intent version. Source screenshot.
The long forms are still early (31 and 63 impressions), so their rates will move as more people see them. What is already clear: the Comparison Chart form out-converts the Pricing Guide Video form at both the short and long length.
4. What this tells us
Three things the data supports, kept honest about what is still early.
The core finding
The form is the lever, not the page
Both landing pages convert at roughly 10%, so the page is not what separates the Comparison Chart from the Pricing Guide Video, and it is not where the high-intent tests are being decided. The form step is. That is good news: forms are quick and cheap to change, and it tells us exactly where to focus the testing.
Insight 2
Short forms win on volume, long forms win on depth
The short "name + email" forms convert far better (47% and 41%). The long forms convert less but hand us boat, budget, and timeline on every lead. This is the same trade we made on purpose in July: a cheaper signup versus a signup we can actually act on.
Insight 3
The high-intent tests are behind, but it is far too early to call them
Variant B trails on both pages (-21% and -74%), but those verdicts rest on just 9 and 4 conversions. That is not enough to conclude anything. We keep them running until the samples are real, rather than reacting to noise.
5. What's next
The honest position: we do not yet have enough statistically relevant data to make any data-driven decisions. The plan for now is to keep running and let the numbers build.
1
Keep the ads running and let the data accumulate
The high-intent forms and page variants have only seen a handful of conversions so far. We keep spending as-is until the samples are large enough to draw a real conclusion, rather than reacting to early noise.
2
Hold off on any changes until the tests reach significance
No page, form, or budget calls made off these early numbers. Once each test has enough volume to be statistically meaningful, we revisit and decide from the data.
3
Add more high-intent signals
Our cost per lead is very good, which gives us room to ask for more. We can layer in additional qualifying fields and capture higher-intent signals from this audience without hurting the economics.